Activity Reports - Console
 Updated 3 hours ago
by
admin
Updated 3 hours ago
by
admin
Activity reports let you view, filter and export the raw activity collected by the modules on your account.
In the console, click Analytics in the left-hand menu. The page shows the Built-in reports and your Custom reports.
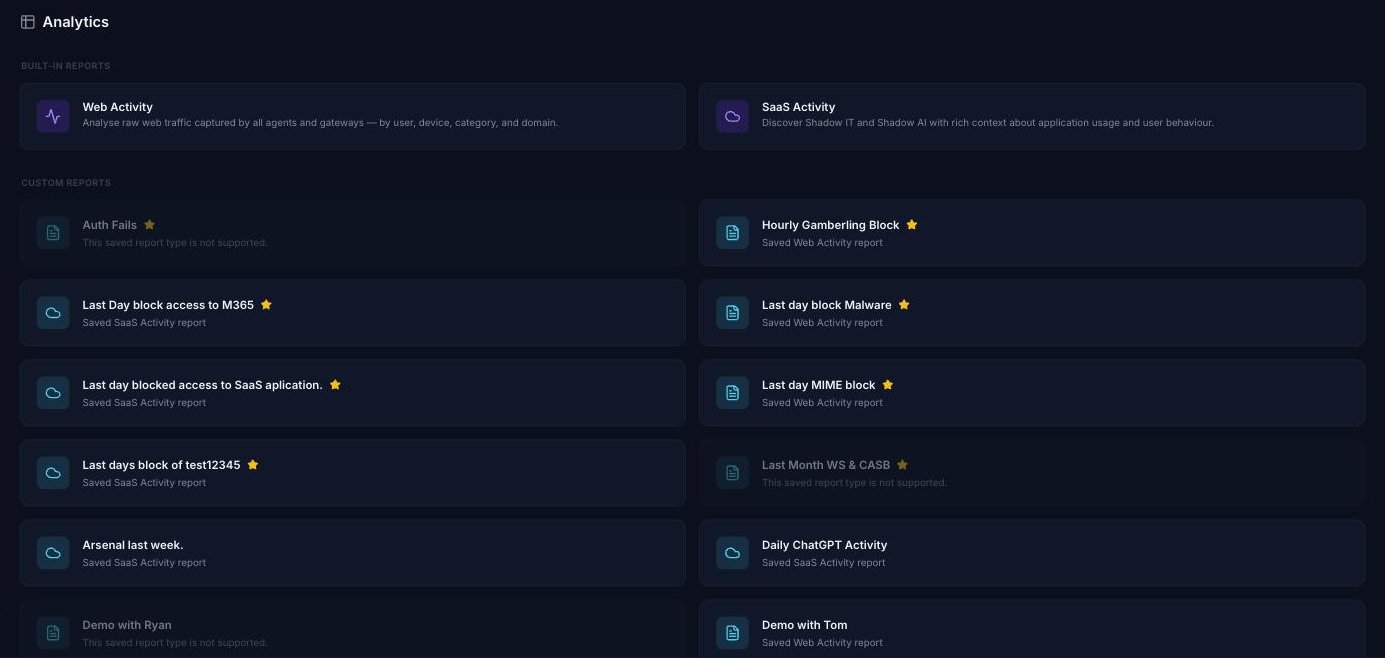
Built-in reports
- Web Activity: raw web traffic captured by all agents and gateways, by user, device, category and domain.
- SaaS Activity: Shadow IT and Shadow AI, with context about application usage and user behaviour.
- Audit: administrator activity and recorded configuration changes (if the Audit module is licensed). See Audit report below.
Running a report
- Open Web Activity or SaaS Activity.
- Choose a Timespan: Hour, Day, Week, Month or Custom (enter a From and To date and time).
- Optionally, click Filters to limit the results (for example by URL, action, filter rule, username, group, tag, device, category or country), then click Apply Filters.
- Click Run Report.
The Timeline shows activity over the timespan, and the results are listed underneath. Click a column heading to sort by it, drag column edges to resize them, and click Columns to show, hide or reorder columns.
Audit report
If the Audit module is licensed on your account, the Audit built-in report shows administrator activity and recorded configuration changes: who changed what, when and from where.
- Click Analytics and open Audit.
- Choose a Timespan and click Run Report.
- Optionally, click Filters to filter by Username, IP, Action (Add, Change, Delete, Modify or View) or Section, then click Apply filters.
The Summary chart shows events over time, split into working hours and out of hours. Switch it to Action or Section to group the events differently, and click a bar to zoom in. Each row shows the Time, Administrator, IP address, Action and Section.
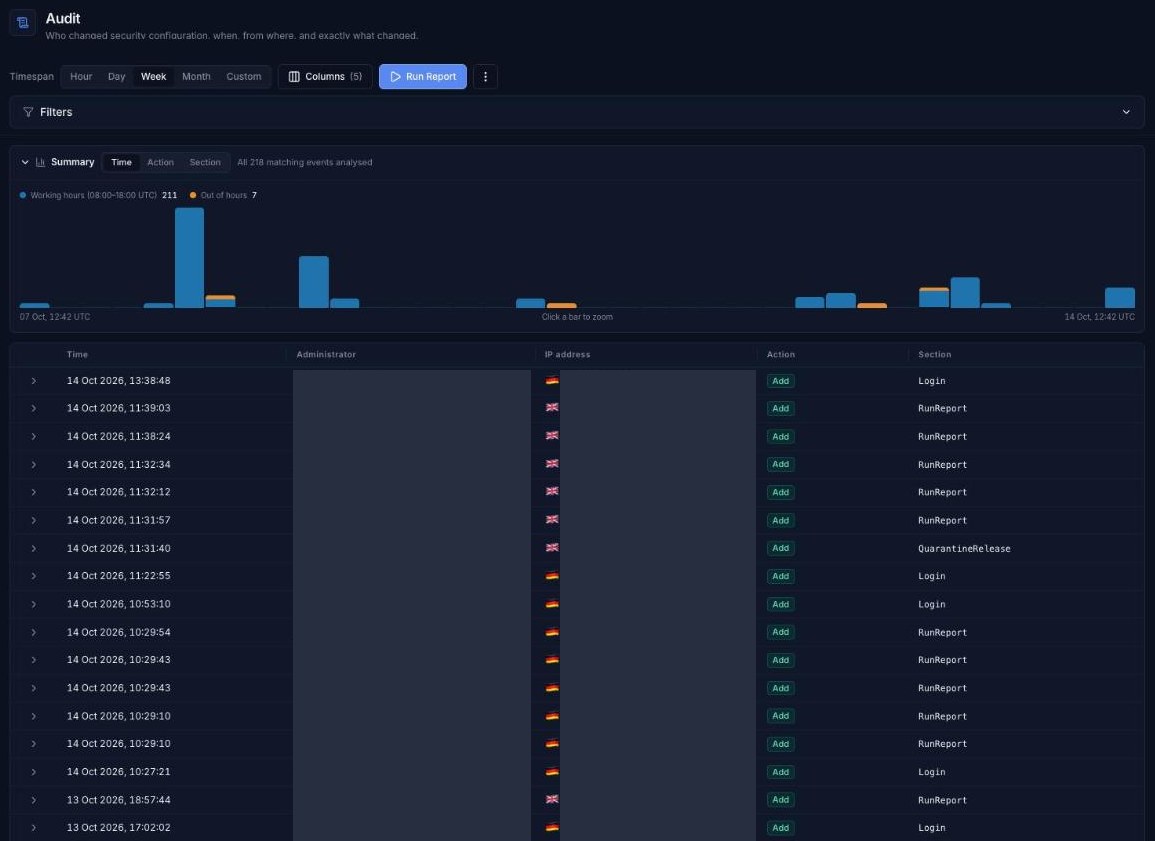
Click the arrow at the start of a row to see the full record, including the HTTP method and endpoint. Before / After compares the original and changed configuration (tick Changed fields only to hide unchanged fields), and Advanced shows the raw data.
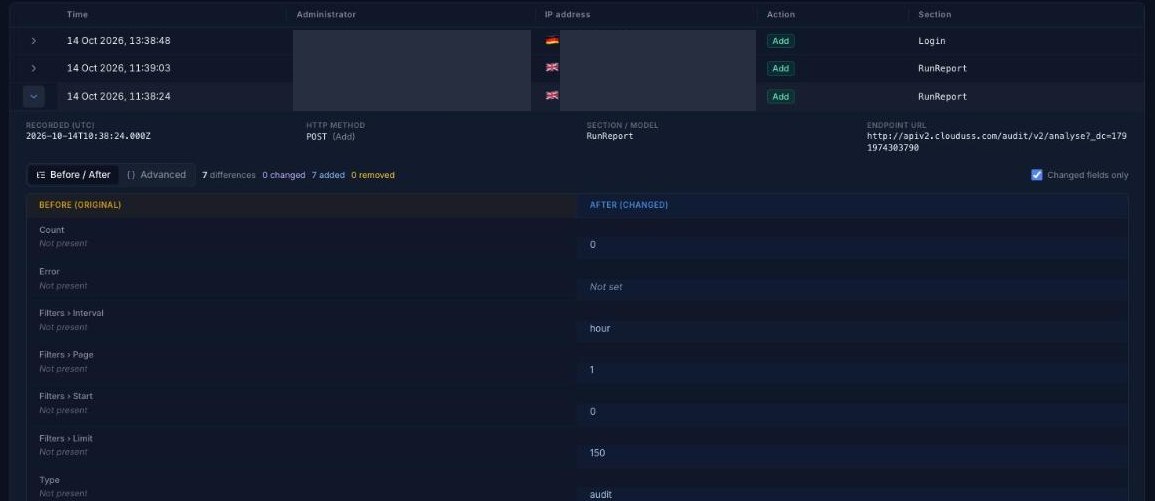
SaaS Activity: viewing details and managing an app
In the SaaS Activity results, click the ⓘ icon at the end of a row to see the full details of that event: the SaaS app (class, name, action, action value, action URL, risk and sanctioned status), identity, request, device, content and network. The details open in a dialog. Click Collapse to drawer to show them in a side panel instead.
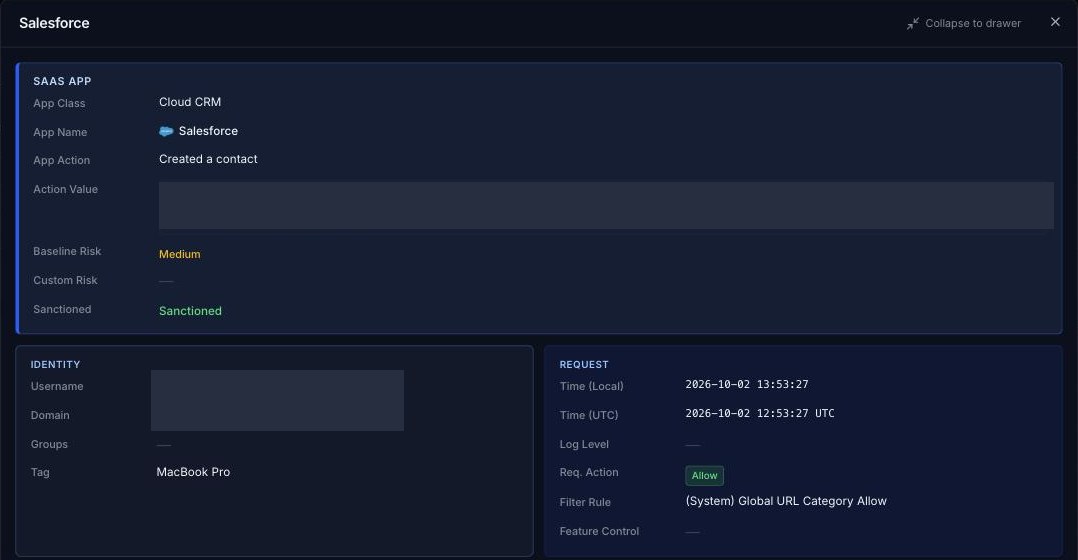
Click the ⋮ button at the end of a row for more options:
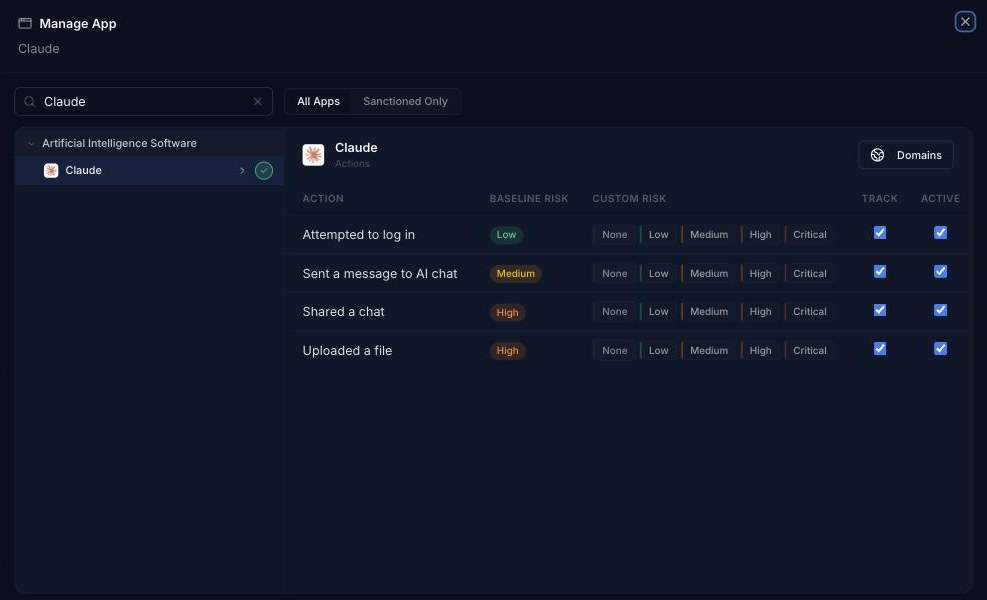
- Manage App: opens the app in the SaaS Catalog, where you can review its actions, baseline risk, custom risk and whether each action is tracked and active. See SaaS Catalog.
- Copy App Name: copies the app's name, for example to use in a filter or rule.

Saving a report
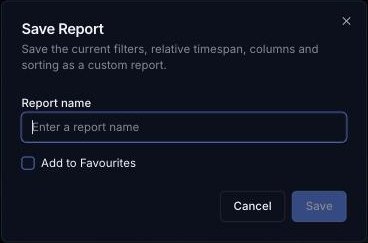
Click the ⋮ menu next to Run Report and choose Save Report. This saves the current filters, relative timespan, columns and sorting as a custom report. Enter a Report name and tick Add to Favourites if you want it in the Favourites list under Analytics in the left-hand menu, then click Save.

Saved reports are listed under Custom reports on the Analytics page. A star shows which ones are favourites.
Deleting a saved report
On the Analytics page, click the bin icon on a custom report's card to delete it.

Downloading a report
Click the ⋮ menu next to Run Report and choose Download to export the results.
Scheduling a report
You can email a saved report automatically on a recurring basis. Click Scheduler under Analytics in the left-hand menu. See Schedules.
Opening a report from a chart or rule
Click part of a chart on the Insights page to open the matching report with its filters already set. You can also open a Web Activity preview from a rule in the Rule Builder.