Posture Management Dashboard (Homepage)
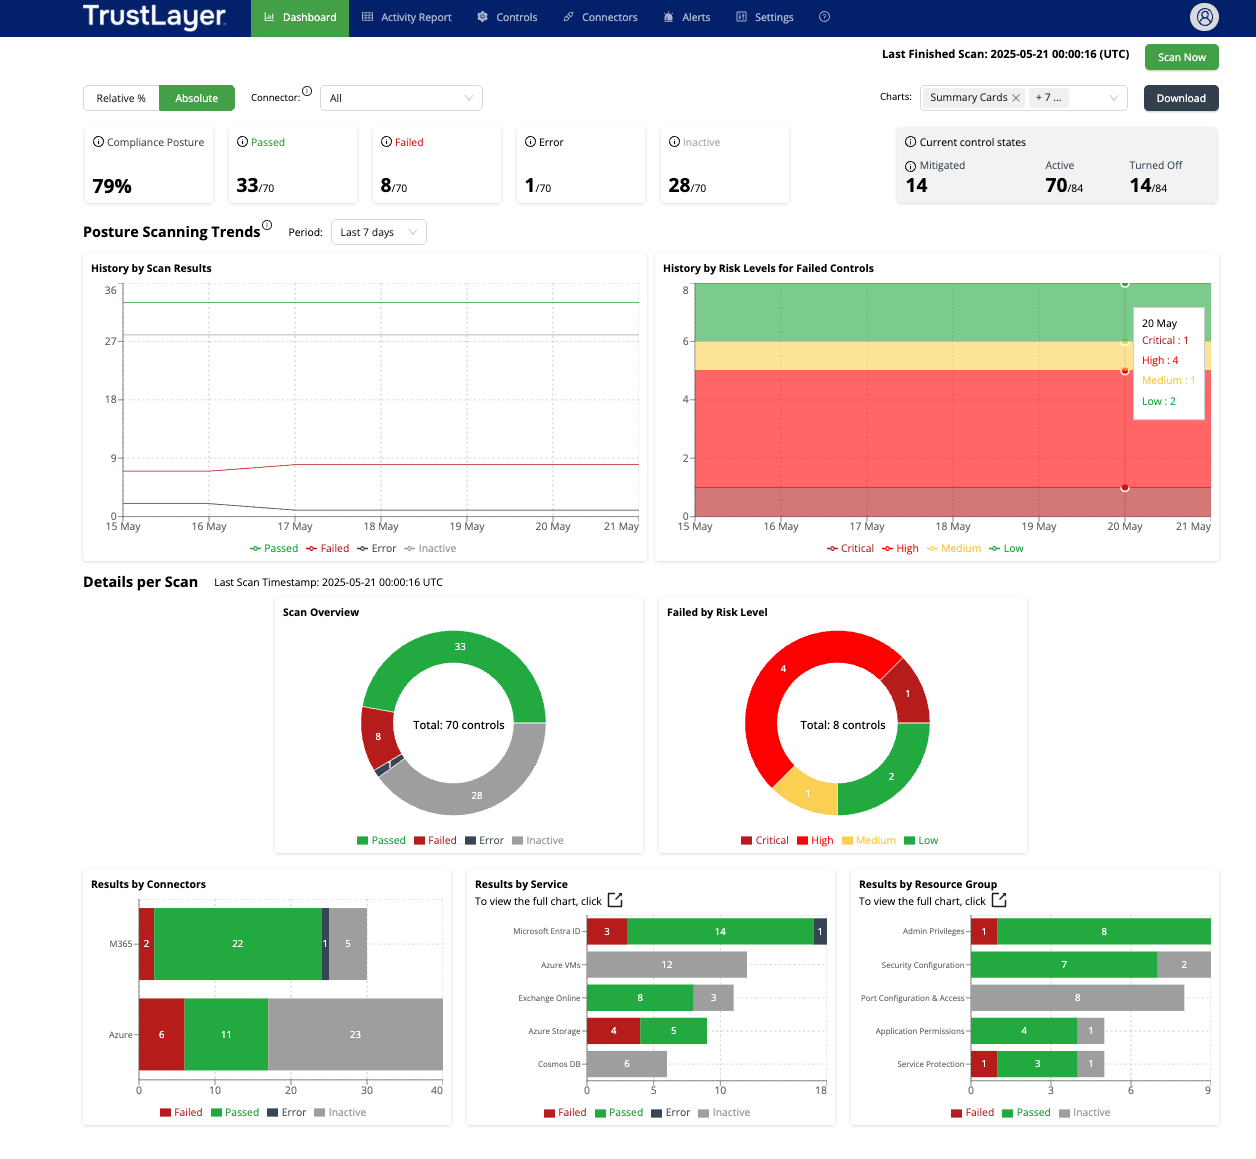
The Dashboard page provides a quick overview of your infrastructure and service posture, presenting essential insights through visual charts based on scan statuses and risk levels.

Scan Statuses
When the Posture Management service finishes a scan, each control is assigned one of the following scan statuses:
- Passed – this status is applied when the checked settings match the control requirements.
- Failed – this status is applied when the checked settings do not match the control requirements.
- Inactive – this status is applied when the evaluated setting is part of a service or resource that is not currently in use. For example, if a control is configured to check settings within virtual machines, but no virtual machines are installed in the service provider's account, the setting would be marked as inactive.
- Error – this status is applied when, due to an error, the Posture Management service cannot check the required settings in the service provider account.
Available Charts
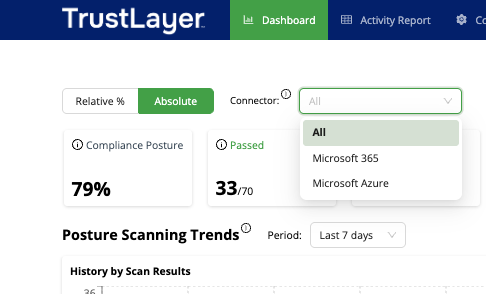
You can review analytics for all active connectors collectively or focus on detailed metrics for each connector.
To select a desired connector, click the Connector drop-down list.

If you see an orange triangle icon  near a connector name, it means that this connector is integrated but disabled. You can review the historical data for its scans; however, this connector is not being scanned now.
All charts are divided into two categories: Posture Scanning Trends and Details per Scan.

Posture Scanning Trends
The Posture Scanning Trends charts display historical data across different periods. The available periods are:
- Today
- Last 7 days
- Last 30 days
- Last 90 days
The following charts are available in the Posture Scanning Trends section:
- History by Scan Results – this chart displays historical data based on scan statuses.
- History by Risk Levels – this chart displays historical data based on the risk levels for controls with the Failed scan status.
Details per Scan
The Details per Scan charts display results from a single scan.
The most recent scan is shown by default. However, you can select a specific date from either the History by Scan Results or History by Risk Levels charts to view statistics for the last scan of that particular date.
The following charts are available in the Details per Scan section:
- Scan Overview – this chart displays a general summary of the scan results organized by status.
- Failed by Risk Level – this chart displays an overview of controls with a Failed status organized by risk levels.
- Results by Connectors – this chart displays the scan results organized by connectors and scan statuses.
- Results by Resource Group – this chart displays the scan results organized by resource groups and scan statuses.